Data Science & Business Intelligence Case Studies

Case Study 1

The Issue

The Expense auditors want to support their current audit practices and move from auditing manually before reimbursing the expenses to a more dynamic risk based approach where in the manual efforts involved are minimal and the tool can detect fraudulent/ fake expenses based on the risk score assigned to various categories. The tool should cover expenses over a period for both employees and case codes.

Solution We Provided

Leveraging Alteryx, we created an app, it did not require any technical knowledge and had a good UI Experience. The users had to input the entire dataset on running the tool and the app generated Excel files as a result as well as refreshed the Tableau Ingestible Files.

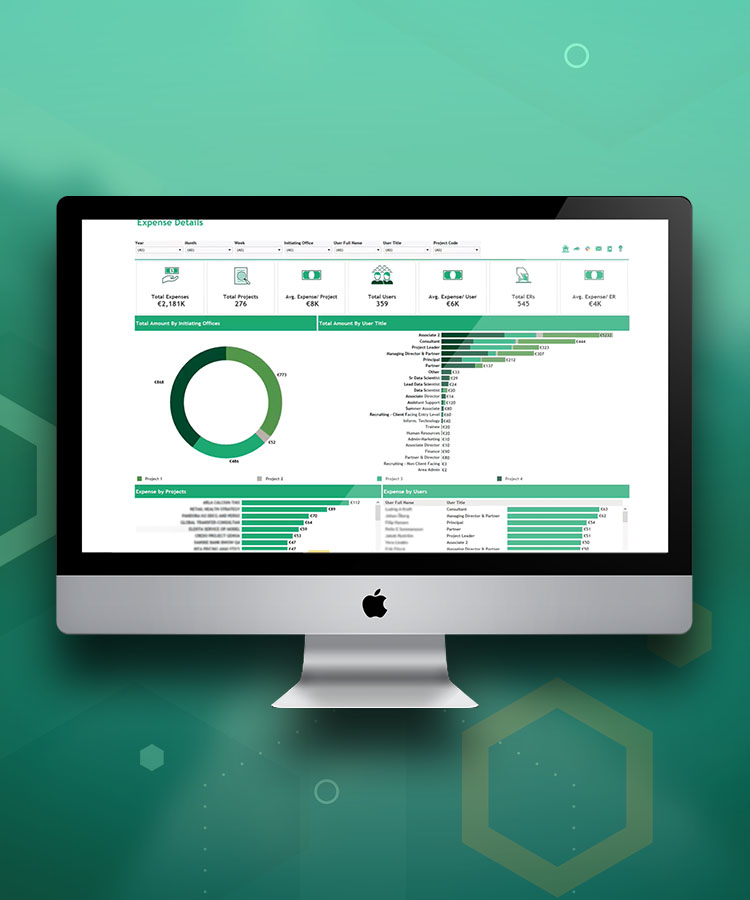
Tableau Dashboard helps to enable a quick and automated risk assessment for major fraudulent categories that the auditors wanted to review the expense claims for. Both the Excel files and Tableau Dashboards analysed risk patterns to track deceitful behaviour and focused on high spend and risk by expense category/ case codes and also highlighted the employees who have filed for exorbitant reimbursements.

The Change

  • Helpful for auditors to know the fraudulent activities at a glance from the Tableau Dashboard.
  • Reduction of manual effort by auditors.
  • Analysis for any time frame has become just a click away for the auditors.
Case Study 2

The Issue

Finance team needed to keep track of Budget and spending but to compile the numbers for different teams was a huge task. Historically, they used to float an excel where different teams put down their numbers. However, the problem was keeping track of the version of this excel and presenting the latest numbers to the executives.

Solution We Provided

Created and published an Alteryx app on Gallery which contains simple Type-in boxes to enter the numbers and dropdown to select the respective department. We do not need any technical knowledge to execute this app, therefore, this could be used by anyone. The numbers collected through this app were stored in a database with a timestamp to maintain logs from where it could be easily downloaded in the format needed.

To further facilitate the team, we created appropriate charts and dashboards in Tableau. These dashboards were live and displayed the updated Finance numbers. Besides that, we also provided the download excel option from these dashboards, therefore, making it one pit stop for all reporting needs.

The Change

  • Swiftly automated the manual process.
  • An effective way to keep the record of the historic data.
  • Also enables users to download the data from the tableau.
Case Study 3

The Issue

Create a full-service dashboard for a finance team to visualize their team’s Income statement as well as see its contribution in the company’s financials, forecast their expenses and income and compare their performance with yester years.

Solution We Provided

The team had their data stored in different places for income and expenses and were visualizing metrics separately. So to minimize this process we have created an Alteryx workflow to collate data for all KPIs and the company’s financials and generate a Tableau Ingestible File.

The workflow is scheduled to run at regular intervals and the data is stored in the warehouse. The tableau dashboards were dynamic and self-supported, users could filter on any KPI and see its forecast as well as historic numbers.

The Change

  • The outcome for this is that the team’s financial health is visualized in one place.
  • Easy for the team to analyze and interpret different KPI’s efficiently and effectively.
  • The executives could extrapolate insights from the historic and forecasted data.
Case Study 4

The Issue

The Sales Team wanted to keep track of the sale and respective attribution for it. Every sales guy used to list down the details of the sales in the CRM system. However, it was observed that there were typos in the form causing confusion at the time of attribution.

Solution We Provided

Using Alteryx, created a fuzzy match logic wherein the names of the people in the sales team were matched with the names in the CRM database wherever the names did not match we use this fuzzy match logic to replace it with the salesman’s name with a certain percent match.

We tried this logic for different combinations and finalized 90% as a threshold percentage i.e. if the match between the salesman’s name in the HR database is 90% similar to that in the CRM database, the deal was attributed to that guy. This workflow was executed every 10 minutes and the result was shown on the Salesfloor using a Tableau Dashboard in real-time. The same logic was further used to even correct the names of the companies having a typographical error.

The Change

  • A robust way to reduce human error.
  • Extremely helpful for validation of the data.
Case Study 5

The Issue

Aviation group felt the need for a more centralized, standardized and uniform reporting solution. Each department had their individual reporting system and required a heavy contribution from the IT department in terms of time and effort to bring together reports from different departments. Data preparation was a tedious task and teams were not able to spare time for data analysis and interpretation.

Solution We Provided

The Aviation group needed a uniform, standardized, group-wise self-service business intelligence solution that had easily accessed data from multiple sources, prepared it quickly, and created reports instantly which was achievable due to Tableau. It got accepted rapidly among the firm.

After usage of the tool for a while, now more than 500 people are using Tableau reports and analysing via Tableau Server and dashboards.

The Change

  • Increase in the company’s efficiency by 30% as data preparation and report generation time has reduced significantly.
  • Faster data preparation is utilized in self-service data analysis, pattern discovery, drawing insights, and report generation.
  •  Enabled users to connect to all sorts of data sources.
  •  Increased the autonomy of users by the virtue of self-service analysis for specialist departments.